Elastic Constants of Fe–Cr Alloys — DFT → ML → CALPHAD → FEM
What is the indentation modulus of an alloy that has unmixed into two phases? Single-crystal elasticity cannot answer it — there is no one crystal to describe.
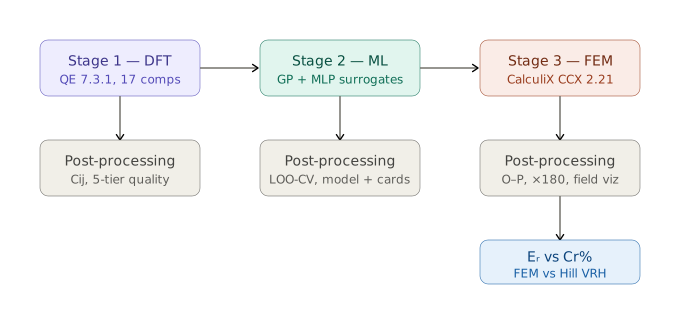
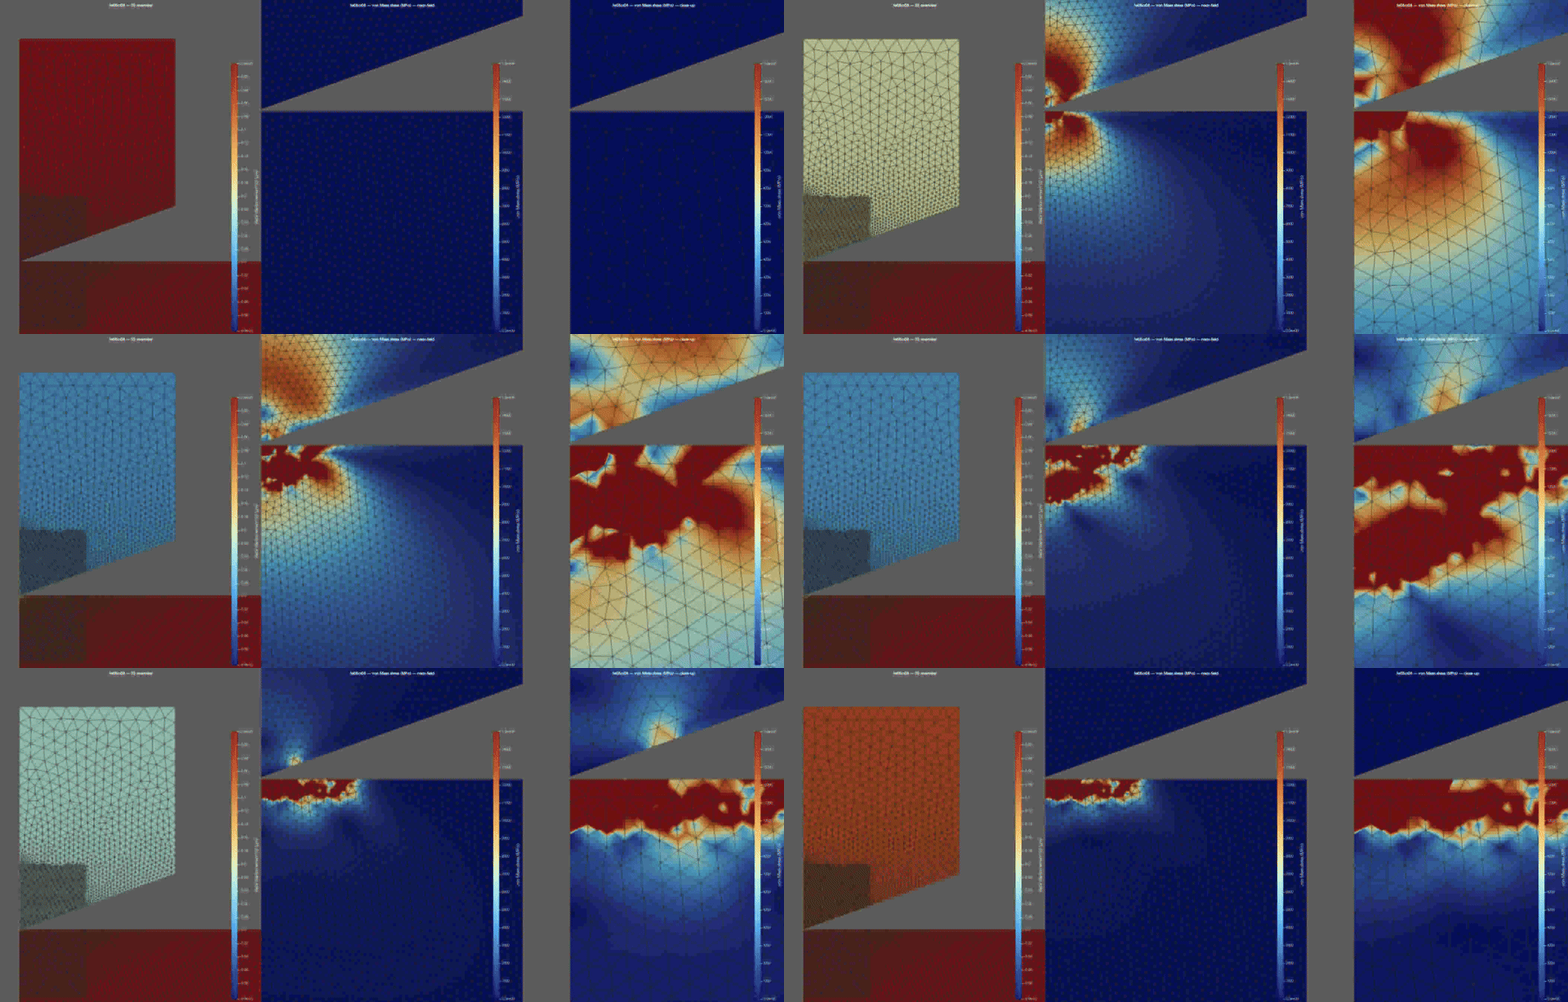
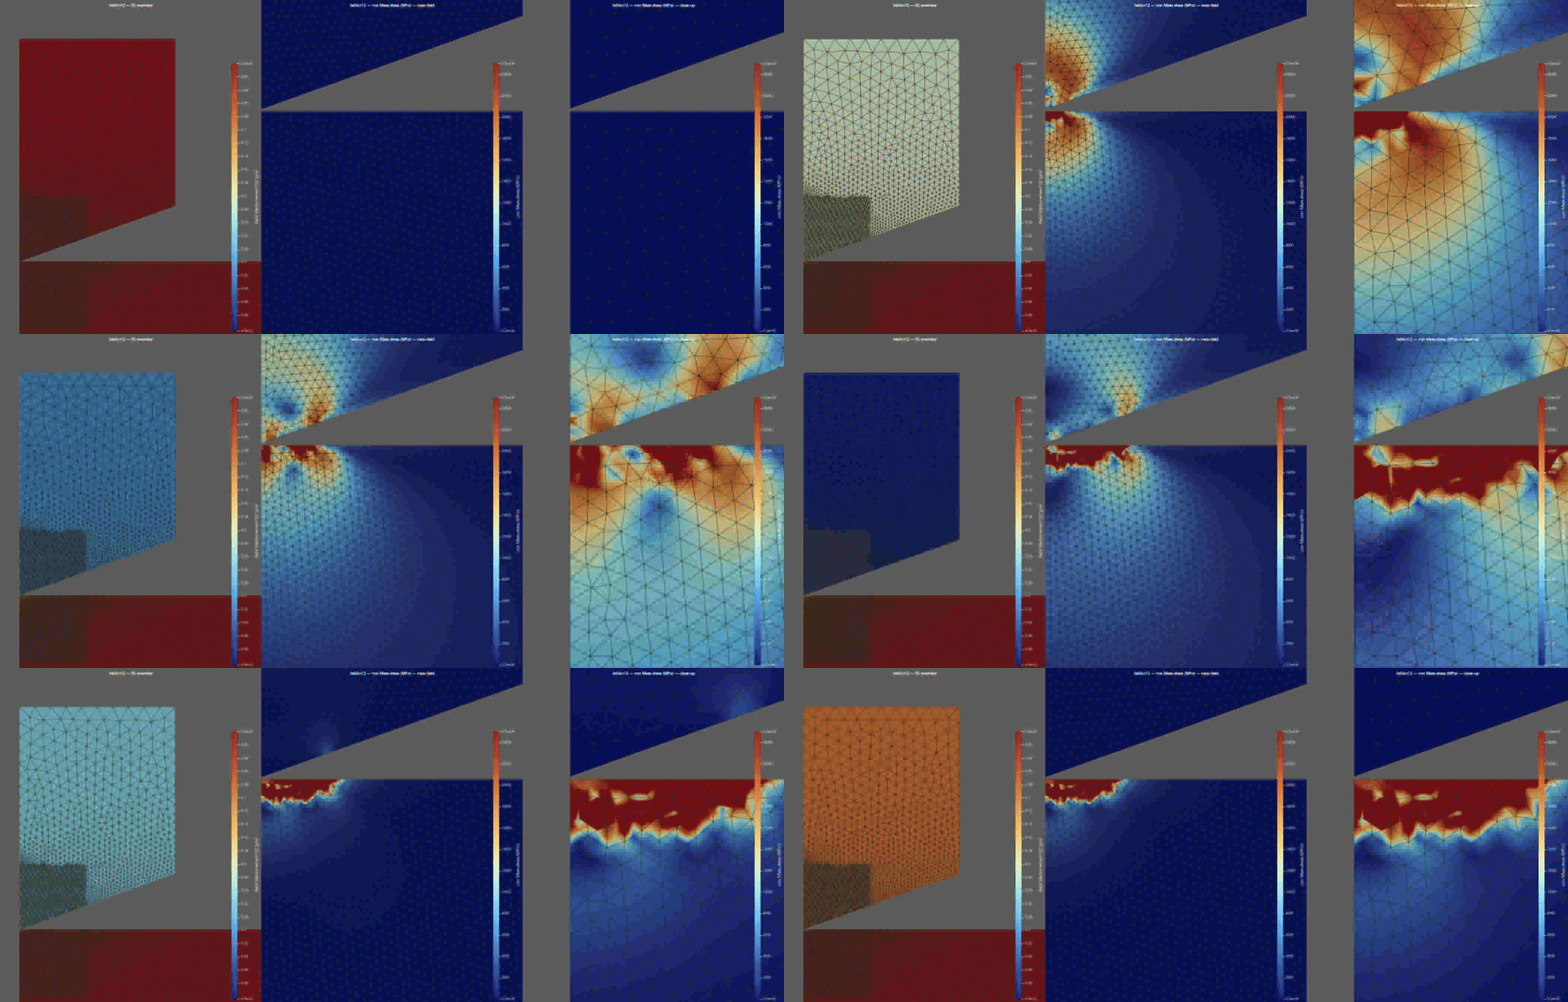
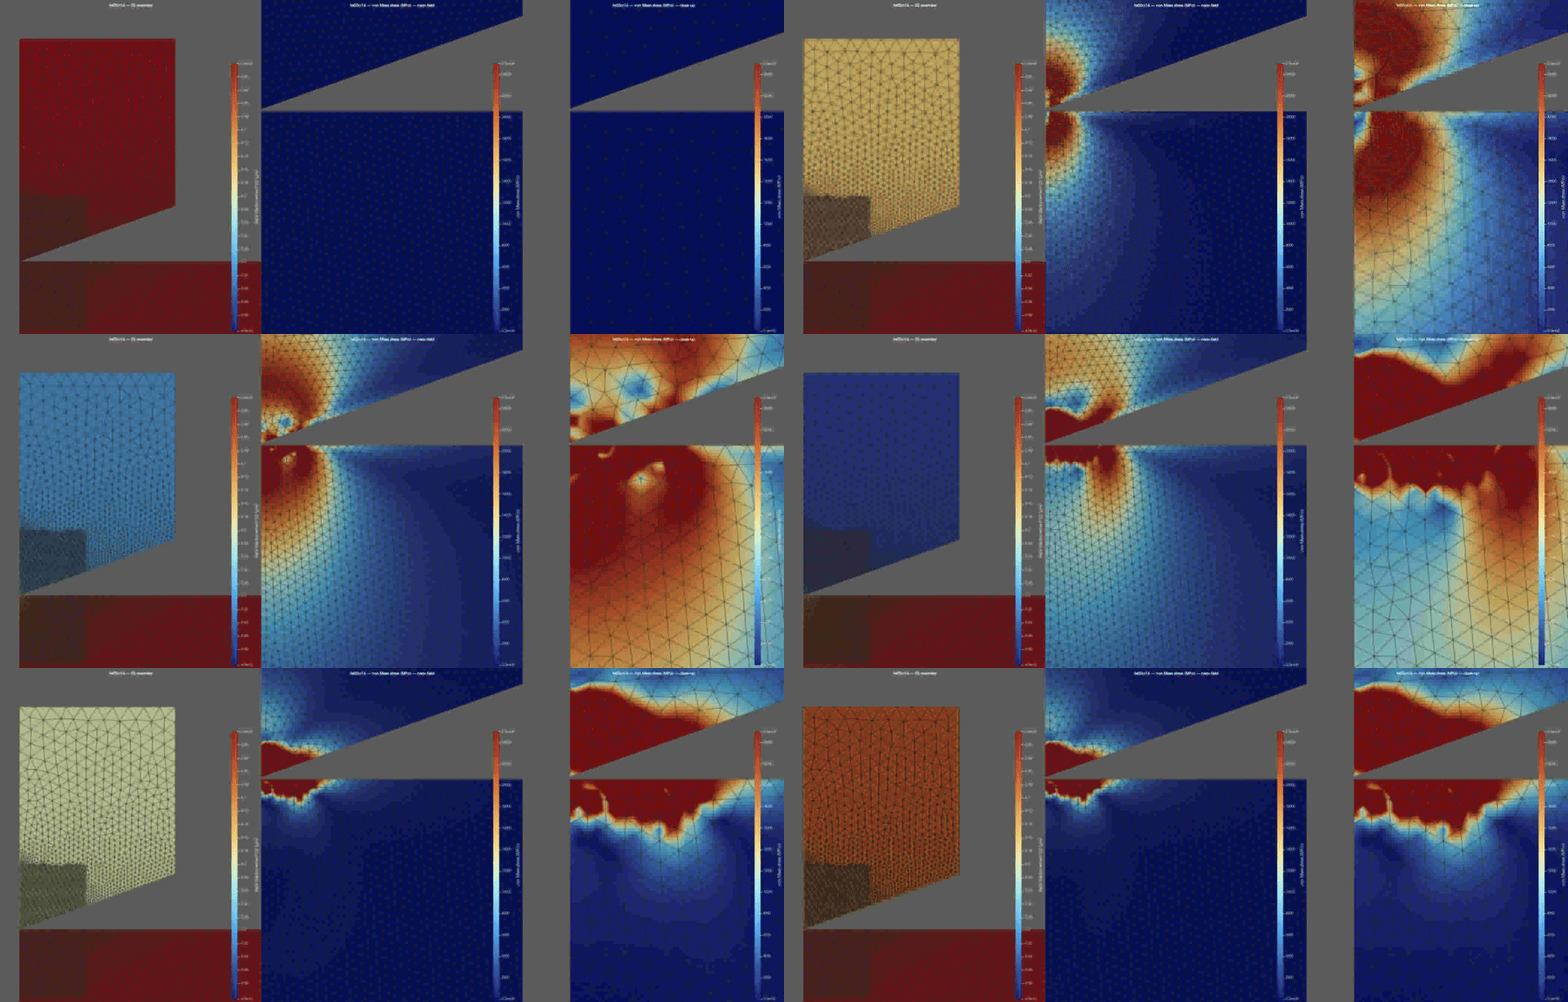
DFT elastic constants for 17 compositions (Quantum ESPRESSO, strain–stress) feed a surrogate model; CALPHAD equilibrium (pycalphad) supplies which phases are stable and what each phase is made of; Voigt-Reuss-Hill and Hashin-Shtrikman homogenisation produce isotropic material cards; CalculiX runs axisymmetric conical nanoindentation and Eᵣ follows by Oliver–Pharr.
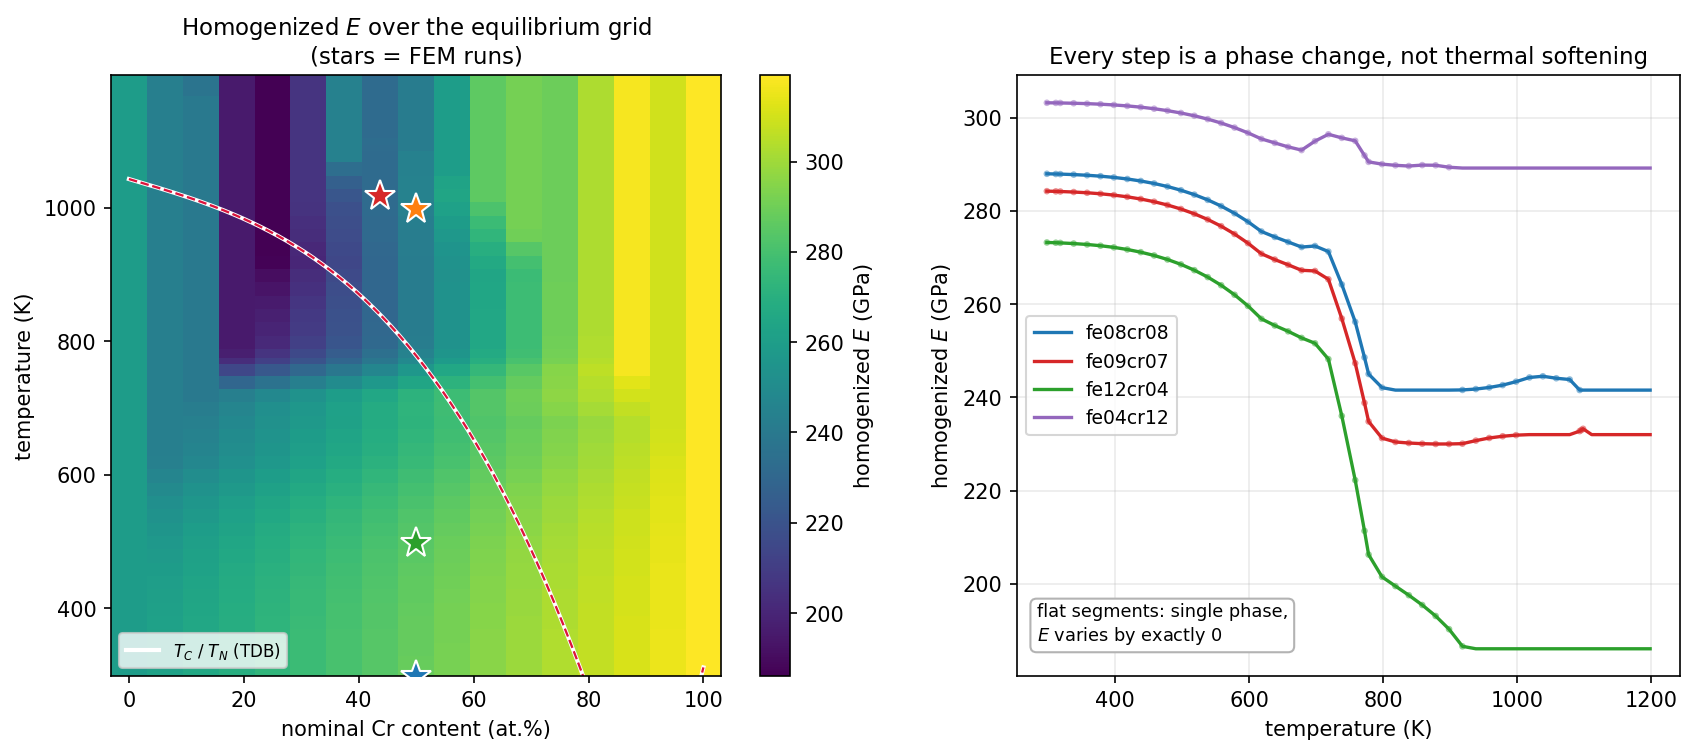
The coupling is the point. The surrogate is queried at each phase's own composition rather than the nominal alloy composition, so it needs no structural or thermal feature — the thermodynamics supplies that context. At 50% Cr and room temperature this matters: equilibrium splits the alloy into two BCC phases, one nearly pure iron and one nearly pure chromium.
Direct interpolation over the DFT points reproduces the surrogate to 1.85% mean deviation, so the elastic constants are DFT-derived rather than ML-approximated. In the single-phase regime Eᵣ tracks the analytical Hill VRH reference within −12% to +7%.
The methodological core was penalty-contact validity. An earlier model generation used a fixed penalty stiffness that saturated silently — a spurious flat Eᵣ ≈ 40 GPa across every composition, clean convergence, no solver warning. It surfaced only by checking observed contact pressure against the K × helement ceiling. Penalty convergence is not physical correctness.
Extension in progress: first-principles elastic constants for the σ phase, which currently inherits BCC-structure values at its own composition.

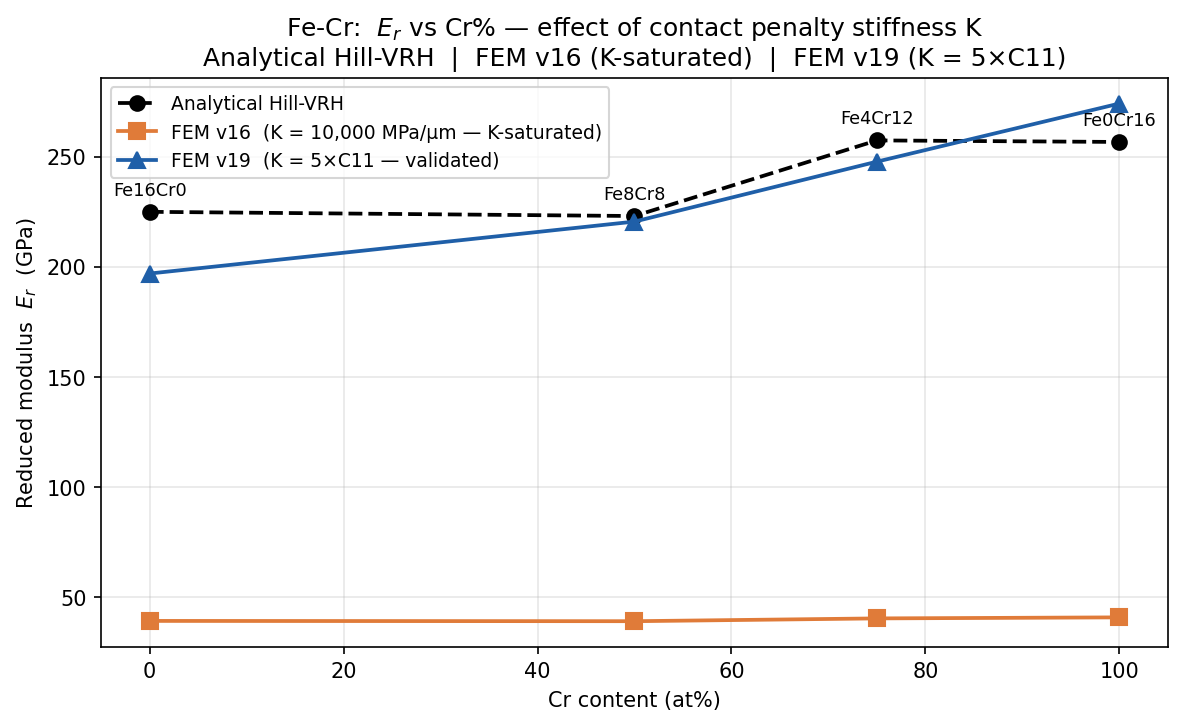

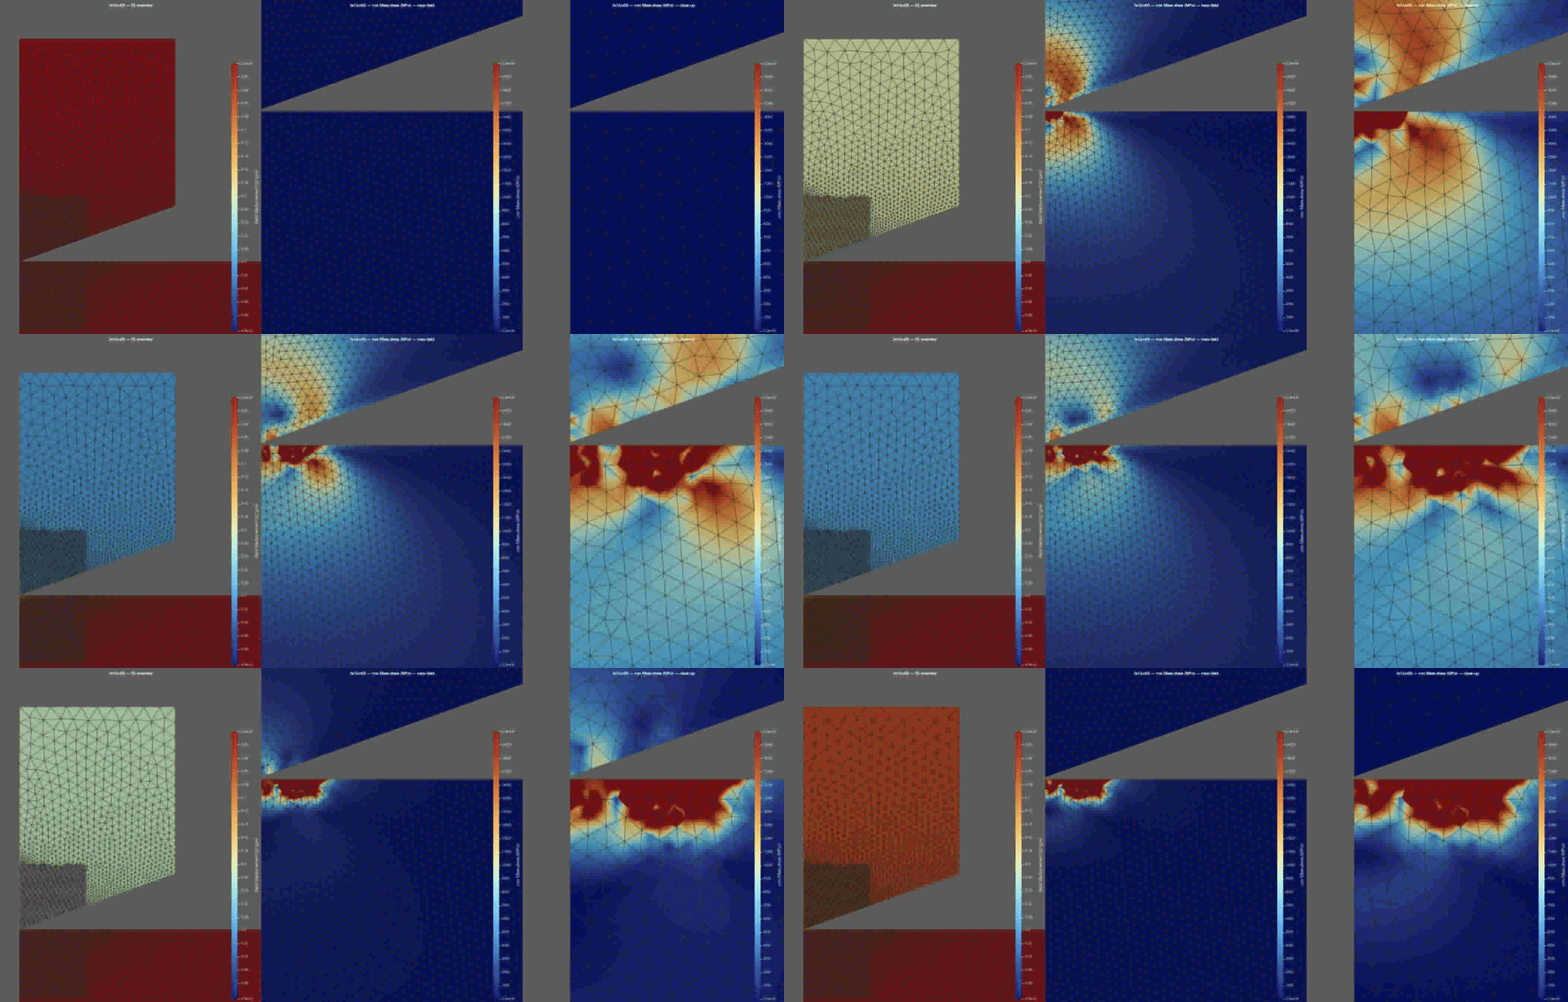
Fe16Cr0 — 0% Cr · Eᵣ = 196.9 GPa (−12.4% vs VRH)
|
Fe8Cr8 — 50% Cr · Eᵣ = 220.5 GPa (−1.1% vs VRH)
|
Fe4Cr12 — 75% Cr · Eᵣ = 247.7 GPa (−3.7% vs VRH)
|
Fe0Cr16 — 100% Cr · Eᵣ = 274.0 GPa (+6.8% vs VRH) ⚠️ AFM
|